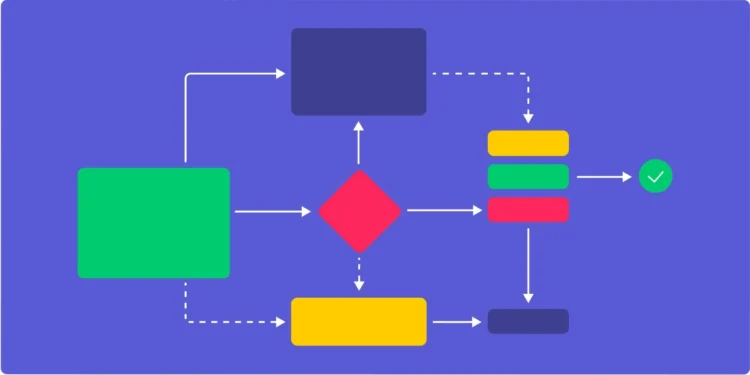
Are you looking for ways to streamline complex workflows?
Flowcharts could be the key to make your workflow easier to understand, helping you achieve better results. This comprehensive guide will walk you through the basics of flowcharts and how they can help simplify your processes.
Benefits of Using Flowcharts

Using flowcharts to visualize and improve workflows can be beneficial for organizations of all sizes. By breaking up complex task processes into isolated and manageable steps, points of inefficiency or over-complexity can be quickly identified. A flow chart creator provides a clear visual, often illustrating relationships between processes or tasks that are not necessarily obvious with a traditional linear list or outline. This makes understanding where inefficiencies are occurring easier, allowing teams to focus their efforts towards improvement as quickly as possible.
They also help teams communicate more effectively, especially when cross-functional cooperation is necessary. For example, when describing an issue to a technical lead, creating a visual representation of the processes can often paint the clearest picture of the problem in question. They also have the potential to clarify roles and communication policies that affect everyone in the organization, making other efforts more efficient by removing confusion from decision making and expectations of performance.
In addition, they are tools that enable stakeholders to easily track progress for any specific task at any given stage of completion. By being able to visualize a process from start to finish using data-driven analysis with feedback loops at each stage, teams can anticipate roadblocks before they even appear and create automated alerts or notifications should action need to be taken alongside routine checking duties. All this combined helps streamline everyday activities while keeping teams goal-oriented and on track with their overall project timelines.
Tips for Optimizing Your Flowcharts
They can be a powerful tool for identifying areas of improvement in any kind of workflow. To get the most out of them, it’s important to create flowcharts that are organized, well-structured, and easy to read. Here are some tips for optimizing it:
- Start with a clear purpose: Begin by writing down the end goal of your workflow – this will help you keep it focused as you build it out.
- Use labels: Make sure every action and step has a clear definition and label that is concise and easy to understand.
- Pay attention to structure: Group related tasks together into logical clusters and connect them with arrows or lines if necessary.
- Be consistent: Use the same symbols throughout the diagram so that readers can quickly recognize elements on the page without searching for them individually in a legend each time they view the chart.
- Test it out: Ask colleagues to review your diagram and make sure it makes sense before implementing changes based on its suggestions!
Examples of Flowchart Applications

They are used for many different applications, ranging from software and project management to business processes. They can be used to create visual representations of various types of processes and thinkers, including decision trees and hierarchical structures. Flowcharts are also commonly used as educational materials to help improve understanding of complex topics.
In business, they are commonly used in process improvement projects as they provide a visual way of capturing existing workflows or creating new ones. By mapping out each step in a task or process, it becomes easier to identify gaps, redundancies or areas where processes could be more efficient.
In terms of software development and computer engineering, various types of flowcharts can be utilized to showcase program logic and organization. This helps programmers visualize the layout of an application and component before coding begins. With flowcharts being added as part of source code documents for many programming languages such as Python and Java, it’s become easier for developers to create detailed diagrams that break down complicated tasks into smaller chunks with less effort than ever before.
Flowcharting Software Solutions
Flowcharting software can be used to effectively visualize the steps involved in any process, making it much easier to analyze and spot areas of improvement. There is a wide range of solutions available, and the one you choose will depend on the size and complexity of your workflow.
Small-scale solutions are great for individual users who just want to quickly brainstorm ideas or draw initial diagrams. Cloud-based tools provide the opportunity to collaborate with different stakeholders while providing access from any device. Automated solutions offer tracking and traceability capabilities for more detailed workflows.
Whichever solution fits your needs the best, take some time before committing so that you are sure it meets all your requirements.
Best Practices for Utilizing Flowcharts

Organizations of all sizes are always looking for improved efficiencies; they can be used to visualize and improve them. In today’s fast-paced, digitally driven markets, workflow is essential for any successful business to stay agile and ensure success. A well-structured workflow strategy will maximize operational efficiency and enable teams to achieve more with less effort. They are a great way to visualize processes so that they are easy to understand, enhance communication between teams and illustrate how the individual components of the process interact with each other.
When incorporating flowcharts in your organization’s Workflow Plan, use the following best practices:
- Utilize consistent symbols throughout your flowchart diagrams – this will help you deliver a clear message and make it easy for everyone in the organization to follow
- Specify detailed steps within each symbol – this will ensure that everyone working on a given process understands all aspects of it
- Label individual shapes with resource names – this will allow employees or established processes (such as automatic tasks) be specifically linked with components of a workflow plan
- Simplify wherever possible – flowcharts should only include information related to an overall process, not too much detailed information
- Include at least two levels of decision points where appropriate – more complex diagrams should include branching options so that team members can plan appropriately
- Add control elements such as loops or arrows as needed – this ensures that each step is connected logically while helping define boundaries within larger workflows.
Conclusion
By reflecting on current processes in detail and mapping out future states, any organization can use flowcharts to create efficiencies that will help them stay competitive. With this guide as a reference tool, you’ll be well on your way to creating an effective workflow map that will ensure easier navigation for everyone involved.


