In the age of technology, data analysis is a necessary skill for students, particularly those who are engaged in academic research.
Whether it is a psychology study, a business case study, or a scientific study, the skill to gather, interpret, and conclude from data can greatly improve the quality and validity of a research project.
For students who need assignment help, learning data analysis is usually an important step towards academic achievement.

This comprehensive guide explores practical strategies to develop effective data analysis skills tailored for academic research. From understanding data types to using software tools and interpreting findings, the sections below cover everything needed to become proficient in data analysis.
Why Data Analysis Matters in Academic Research
Data analysis enables researchers to reveal patterns, test hypotheses, and confirm arguments with empirical data.
In academic environments, the process not only justifies conclusions but also shows rigorous thinking and methodological consistency.
Advantages of Good Data Analysis Skills
- Better academic performance: Correct interpretation of data results in well-supported arguments in essays and dissertations.
- Better critical thinking: Data analysis promotes objective reasoning and logical problem-solving.
- Credibility of the research: Conclusions that are supported by data enhance the overall credibility of the research.
- Effective utilization of resources: Quality analysis enables us to know what is important, thereby saving time in research.
Types of Data for Academic Research
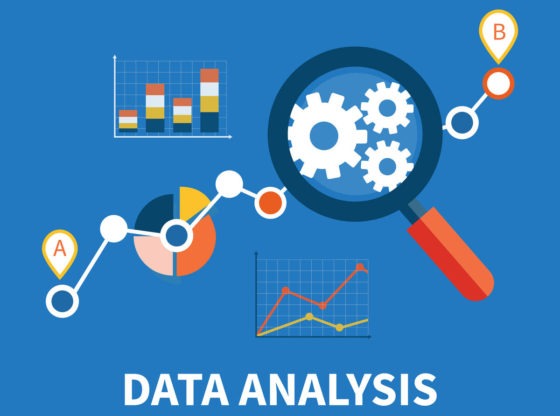
Knowledge of the types of data utilized in research is the cornerstone of effective analysis. Each type needs to be analyzed in a different manner.
1. Quantitative Data
Quantitative data consists of numerical values which can be measured and statistically examined. Examples are test scores, income levels, and temperature readings.
2. Qualitative Data

This category consists of descriptive or non-numerical data like interview transcripts, open-ended survey responses, or thematic analysis of literature.
3. Primary vs Secondary Data
Primary data is gathered first-hand through experiments, surveys, or observations.
Secondary data is derived from pre-existing sources such as journal articles, databases, or historical records.
Knowing what kind of data applies to a particular research question can enhance the precision and clarity of the analysis.
Major Data Analysis Techniques Utilized in Academic Studies
Various fields of study use varied methods, but the following are a few of the more general data analysis techniques:
Descriptive Statistics

These give an overview of the fundamental characteristics of data in terms of measures such as mean, median, mode, and standard deviation.
Inferential Statistics
These enable researchers to make conclusions and predictions from sample data, employing tools such as t-tests, chi-square tests, and regression analysis.
Thematic Analysis
Applied in qualitative research, this technique detects recurring themes or patterns in textual data.
Content Analysis

This entails analyzing communication materials (e.g., books, articles, social media) to interpret meaning.
Comparative Analysis
This method compares various datasets to detect similarities or differences, commonly applied in case studies.
Essential Software Tools for Data Analysis

The appropriate software can automate the data analysis process and minimise human error. For students seeking assignment help, becoming familiar with effective tools can make research tasks significantly easier. Some of the most frequently used tools in academic environments are:
1. Microsoft Excel
Simple but capable for descriptive statistics, charts, and pivot tables.
2. SPSS (Statistical Package for the Social Sciences)
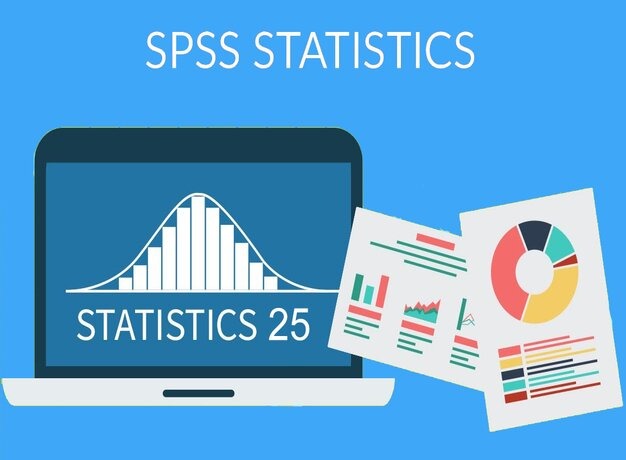
Popularly used for statistical analysis of social science research.
3. R and RStudio
Open-source programming language for more sophisticated statistical modelling and visualisations.
4. NVivo
Popular with qualitative data analysis, especially for coding and theme development.
5. Python
Another open-source language great for data mining, machine learning, and large dataset analysis.
How to Develop Data Analysis Skills: Step-by-Step
Step 1: Understand Your Research Objectives

Prior to plunging into analysis, define the purpose of your research. Ask yourself questions like:
- What am I attempting to discover?
- What information will address my research question?
- What form of analysis should be used?
Step 2: Learn Statistics Basics
You can even benefit from knowing the basics about statistics. Look into:
- Measures of central tendency (mean, median, mode)
- Probability and distributions
- Correlation and causation
- Significance testing (p-values)
A number of free online books and courses provide some foundational information.
Step 3: Practice on Actual Datasets
Hands-on experience is essential. Utilize open-access data from government portals, academic sites, or public repositories.
Attempt exercises such as:
- Calculating averages and generating graphs
- Executing regression analyses
- Performing thematic coding over textual data
Step 4: Get Acquainted with Analysis Tools
Select a software package based on your industry and become proficient in it. Most packages have student editions or free trials.
Step 5: Enroll in Online Courses or Workshops

Courses on data analysis are available on platforms such as Coursera, FutureLearn, and LinkedIn Learning for students.
Step 6: Participate in Research Communities or Study Groups
Discussing with peers or academic forums assists in sharing knowledge and resolving doubts. Look into student research societies or online communities dedicated to academic skills.
Common Challenges and How to Overcome Them
1. Misinterpreting Data
Solution: Cross-verify findings through alternative methods or consult trusted sources.
2. Selecting the Wrong Analysis Method
Solution: Know the data type and aim of research first before choosing the method.
3. Dependence on Software
Solution: Avoid using software like a black box. Learn why the functions work.
4. Poor Data Cleaning
Solution: Take time cleaning out duplicates, dealing with missing values, and normalising formatting.
Tips for Improving Your Data Interpretation Skills
Properly interpreting results is equally as crucial as performing the analysis.
- Avoiding bias: Ground interpretations only on what the data indicates.
- Use imagery: Charts and graphs are the best ways of communicating results unambiguously.
- Reference literature: Determine if your findings cohere with, or contradict, earlier studies.
- Communicate simply: Place your results briefly and clearly to a specific frame.
Achieving Success through Data Analysis

Effective data analysis can make the average assignment highly persuasive scholarly discourse. Be it a laboratory report or an end-year dissertation, being able to analyze has an impact that greatly leads to A+ scores.
Most students seek assignment assistance when having trouble with data-intensive assignments. While outside help may offer a safety net, building inner competence guarantees enduring academic development and self-assurance.
Conclusion
Mastering the basics of data analysis requires time, effort, and the appropriate tools. By acquiring fundamental statistical concepts, selecting appropriate tools, and implementing best practices, students are significantly enhancing the quality of academic research.
For students who require support from time to time, third-party companies such as Assignment in Need (assignnmentinneed.com) can provide quality assignment assistance. Yet, proficiency in data analysis guarantees sustained academic achievement and research skills.
Master the craft, and the data will tell its own story.


