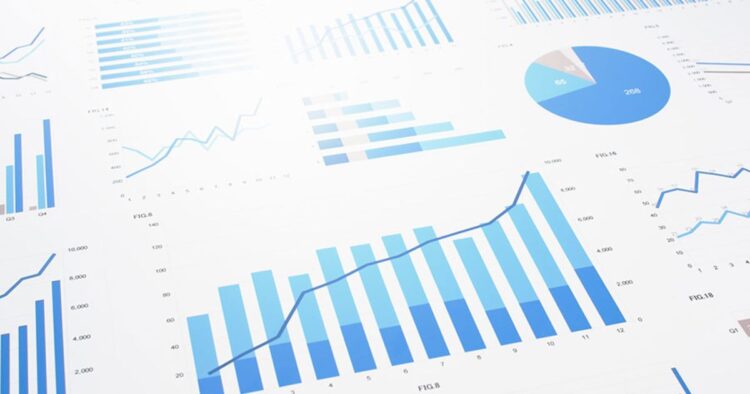
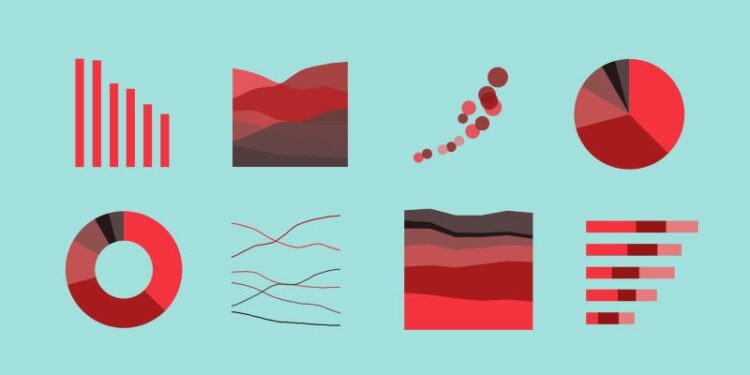
As a student pursuing a computer science, engineering, or any other information technology major, it is imperative to understand the importance of graphs and figures in your STEM papers. Whether you are studying at the best schools like Harvard or taking online courses from an academy, scientific and computing papers are expected to include technical terms, equations, and graphs.
The purpose of these papers is to effectively communicate your ideas and findings. Utilizing graphs and figures can aid in presenting complex concepts clearly and concisely. In this article, we will delve deeper into the significance of graphs and figures, along with some tips and tricks on how to use them effectively. So, if you want to improve the quality of your papers, keep reading.
Why are Graphs and Figures Important?

There are several reasons why graphs and figures are essential in STEM papers:
- Enhance Understanding: Visual aids such as graphs and figures are powerful tools for enhancing understanding and conveying complex information. In STEM papers, researchers often have to present large amounts of data, and it can be challenging for readers to understand the key points and how they support the conclusions without visual aids. Graphs and figures can help by presenting data in a clear and concise way. They can show patterns and trends that may not be apparent from a table or text, and allow readers to compare data sets and understand the relationships between variables. The use of graphs and figures in STEM papers can greatly enhance understanding and help researchers communicate their findings to a wider audience. By presenting data visually, researchers can make it easier for readers to interpret the information presented and appreciate the significance of the research.
- Increase Clarity: Using graphs and figures in STEM papers can increase clarity and make the paper more concise and easier to read. A well-designed graph or figure can convey more information in a single image than in a paragraph of text. By summarizing key findings in a visual format, researchers can present information more clearly and concisely. This can help readers quickly understand the main points of the research and the significance of the findings. Using well-designed graphs and figures can help to increase clarity and make STEM papers more concise and accessible to readers. By presenting key findings in a visual format, researchers can make it easier for readers to understand the main points of the research and appreciate the significance of the findings.
- Demonstrate Results: In STEM papers, graphs and figures are also important for demonstrating the results of research. They can provide concrete evidence to support claims and give readers a sense of the impact of the work. This is especially important in fields such as science and engineering, where experimental results play a critical role in validating hypotheses and theories. By presenting data in a visual format, researchers can provide a clear and compelling way to demonstrate the results of their research. This can help readers to understand the scope and impact of the work, and to appreciate its significance. For example, a graph showing the results of an experiment can provide a clear demonstration of the effect of a particular treatment or intervention. Similarly, a figure showing the structure of a novel molecule can help readers to understand how it differs from existing compounds and why it may be important. By presenting results in a visual format, researchers can also help to convey the complexity and richness of their data. This can help readers to appreciate the scope and depth of the research and to understand the nuances of the results.
Tips and Tricks for Effective Use of Graphs and Figures

Now that we have discussed the importance of graphs and figures let’s take a look at some tips and tricks for using them effectively:
- Keep it Simple: While graphs and figures can be powerful tools, it is essential not to overload them with too much information. Keep your graphs and figures simple and straightforward, focusing on the key points you want to convey.
- Choose the Right Type of Graph: Different types of data require different types of graphs. Bar graphs are useful for comparing values, line graphs are helpful for showing trends over time, and pie charts are useful for showing how a whole is divided into parts.
- Label Everything: Label all axes, units, and data points on your graphs and figures. This will ensure that your audience can understand the graph and interpret the results correctly.
- Use High-Quality Images: If you include images or screenshots in your paper, ensure they are of high quality and resolution. Low-quality images can make it difficult for readers to interpret the data.
Interesting Facts about Graphs and Figures

- Graphs and figures have been used in scientific papers for centuries. One of the earliest known examples is a graph showing the growth of a sheep population, created by British statistician John Graunt in 1662.
- The use of graphs and figures is not limited to scientific papers. They are also commonly used in business reports, marketing materials, and educational resources.
- One of the most famous examples of a graph is the “hockey stick” graph, which shows the rapid increase in global temperatures over the past century. The graph was created by climatologist Michael Mann and has been the subject of much debate and controversy.
Including graphs and figures in your STEM papers is crucial for enhancing the impact and effectiveness of your research, whether you hold a degree in computer science or aspire to become a scientist. In the realm of comp and tech, these visual aids provide a clear and concise representation of theoretical concepts, making them easier to understand. Remember to keep them simple, label them correctly, and choose the appropriate type of graph or figure for your data to maximize their impact. And if you’re having trouble with your CS homework and need help with your assignments, don’t hesitate to get CS homework help from Cwassignmnets.com.


